Visualize Results
To view a topical breakdown of your search results, open the Exports dropdown menu and select Visualize Results. For result sets containing 5000 records or less a FoamTree visualization can be created with labeled clusters representing the topics within the record set. A dialog will appear displaying the application's default field selections used to populate the visualization. To customize the fields used for visualization select and deselect field preferences then click Submit in the bottom right corner of the dialog.
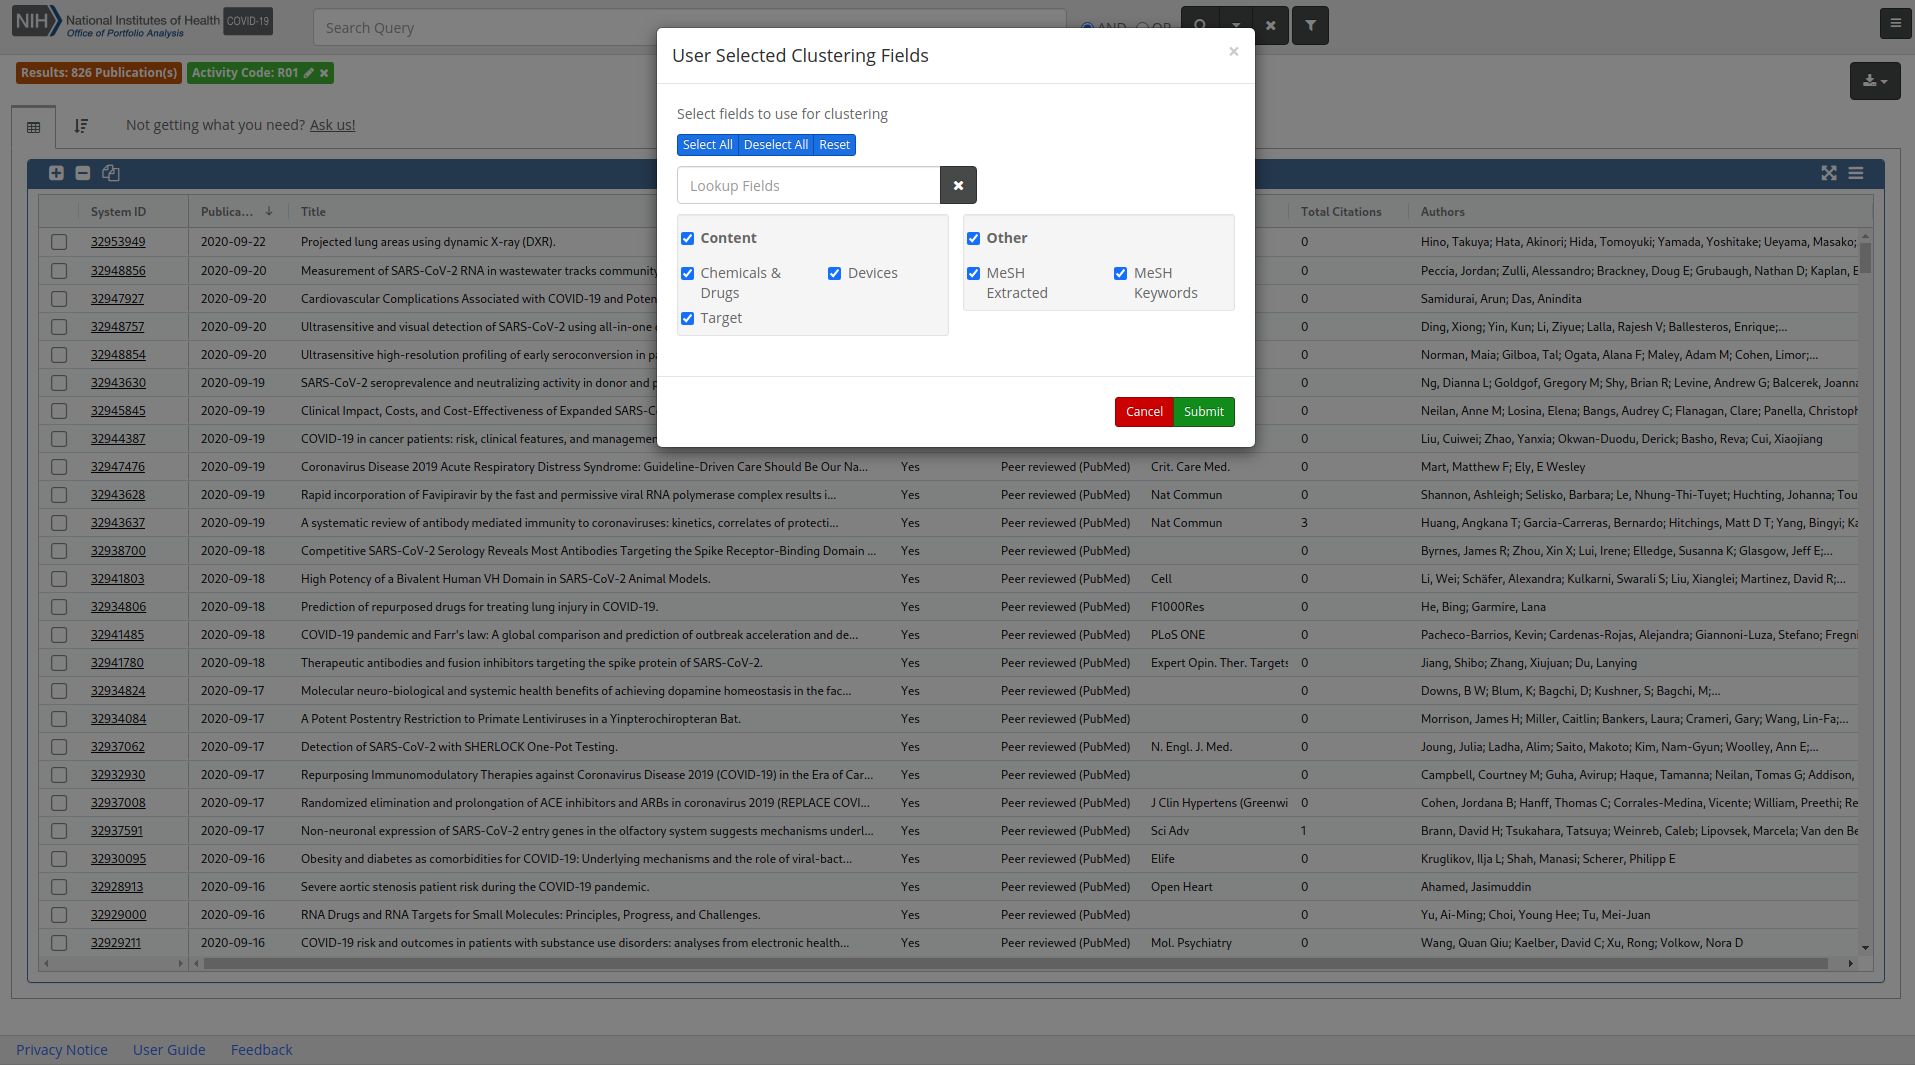
Method
Visualize Results uses a clustering algorithm (lingo3g) which takes words and phrases from the Chemicals & Drugs, Targets, and MeSH fields. The clusters displayed are scaled to the number of publications. Words are clustered based on how often they occur together in the same document. Before clustering, documents are preprocessed using stemming, stop words, and synonym normalization.
Navigating
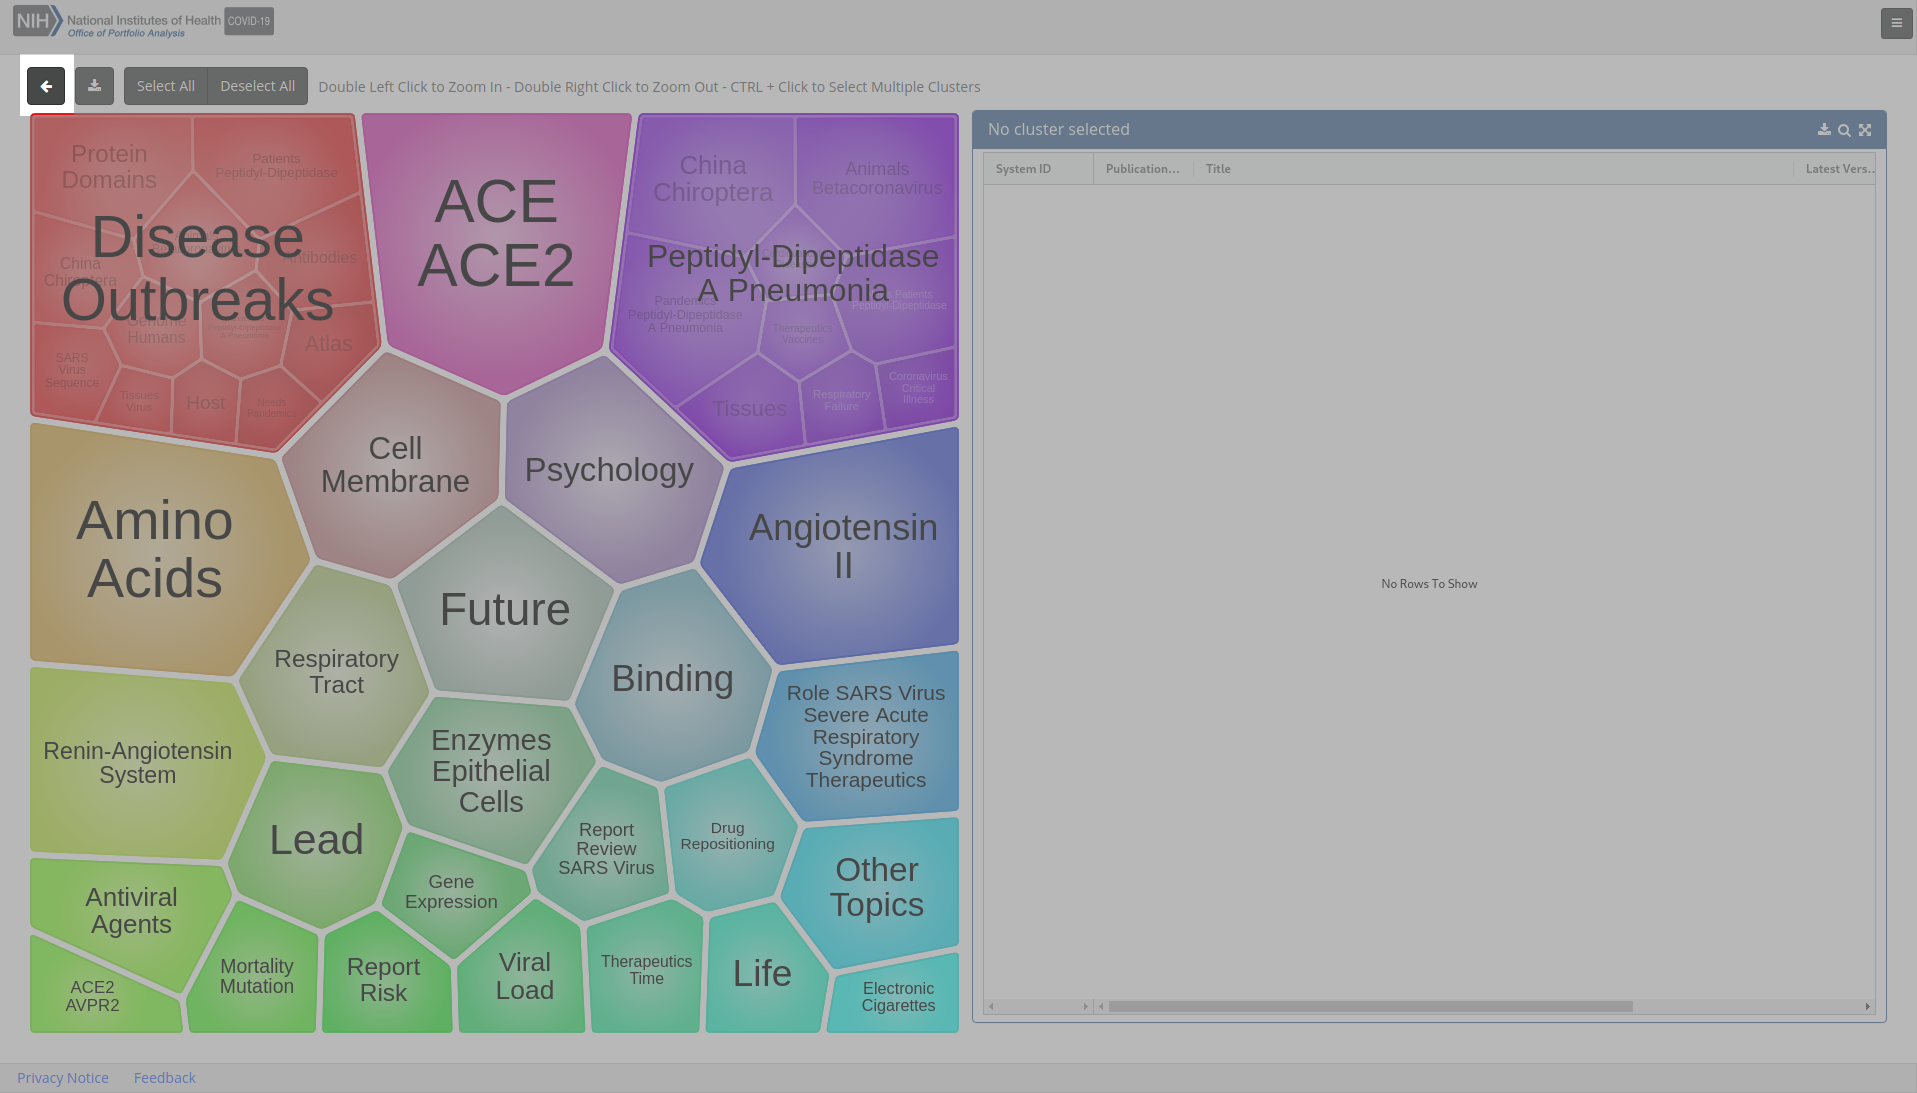
The FoamTree visualization will appear in a panel on the left, while an empty table will appear in a panel on the right.
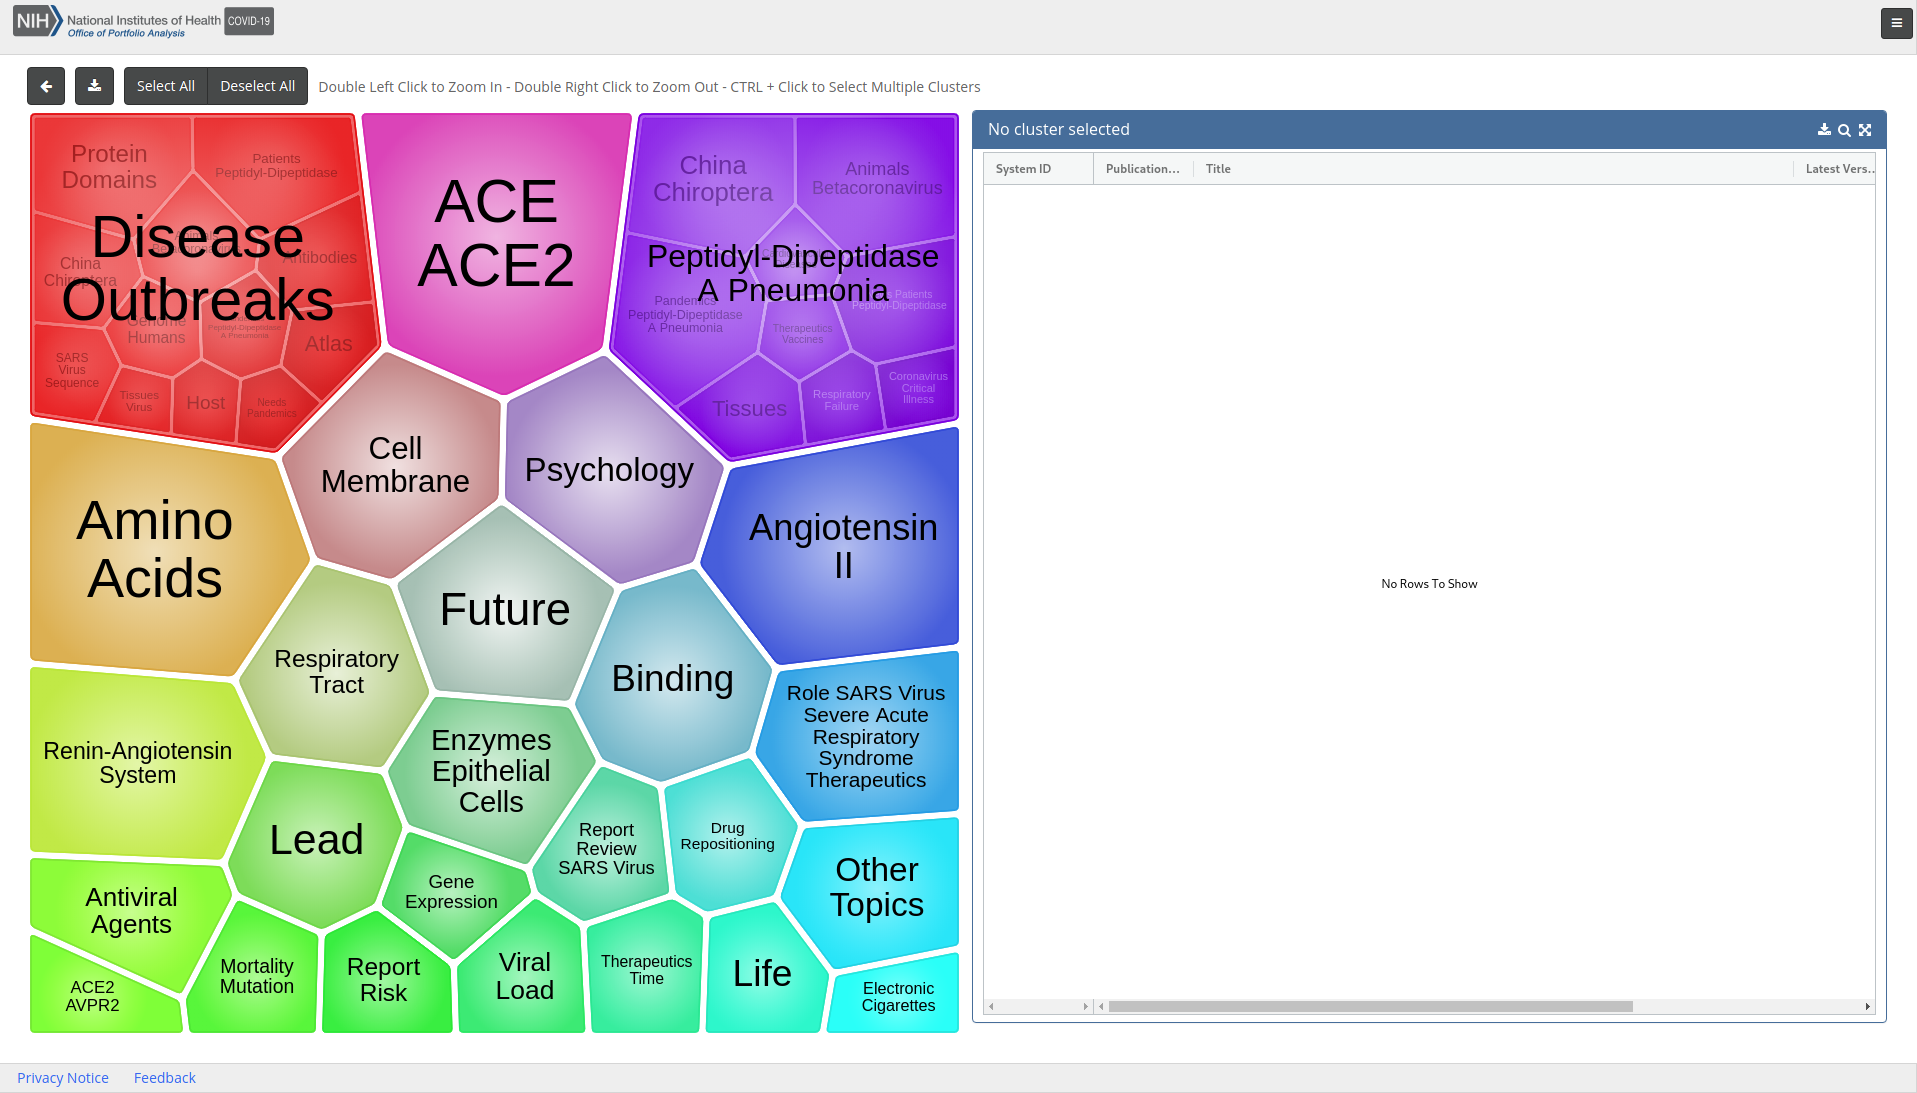
To view the records that comprise a cluster single left click on a cluster and the panel on the right will be populated with the records contained within the cluster. To zoom in on a cluster to view the cells within it, double left click.
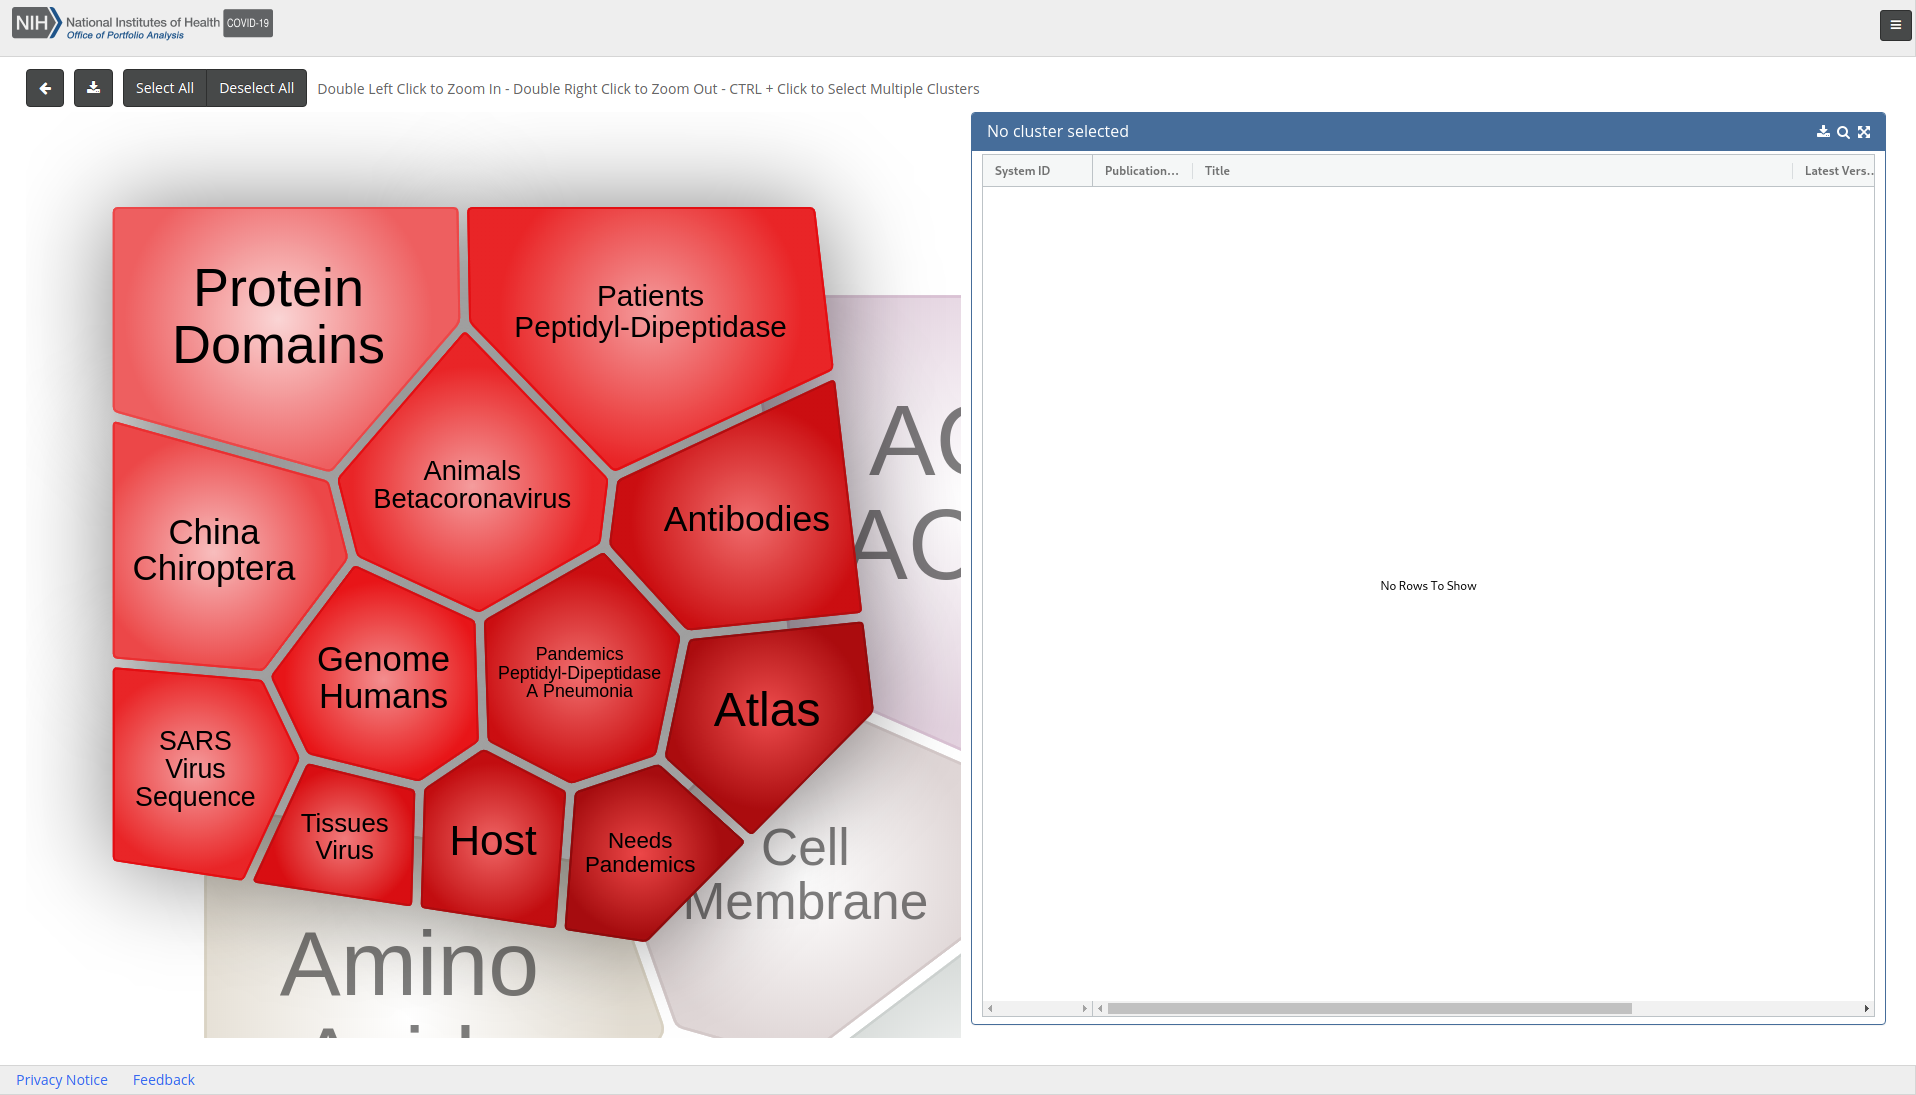
To view the records within an individual cell of a cluster, single left click on the cell and the records will appear in the right-side panel.
To zoom out of a cell or cluster, double right click.
To select multiple clusters or cells of interest, hold down the Ctrl (or Apple) key while clicking on the clusters and cells of interest to select them. The records that comprise the selected clusters or cells will appear in the table on the right-side of the page.
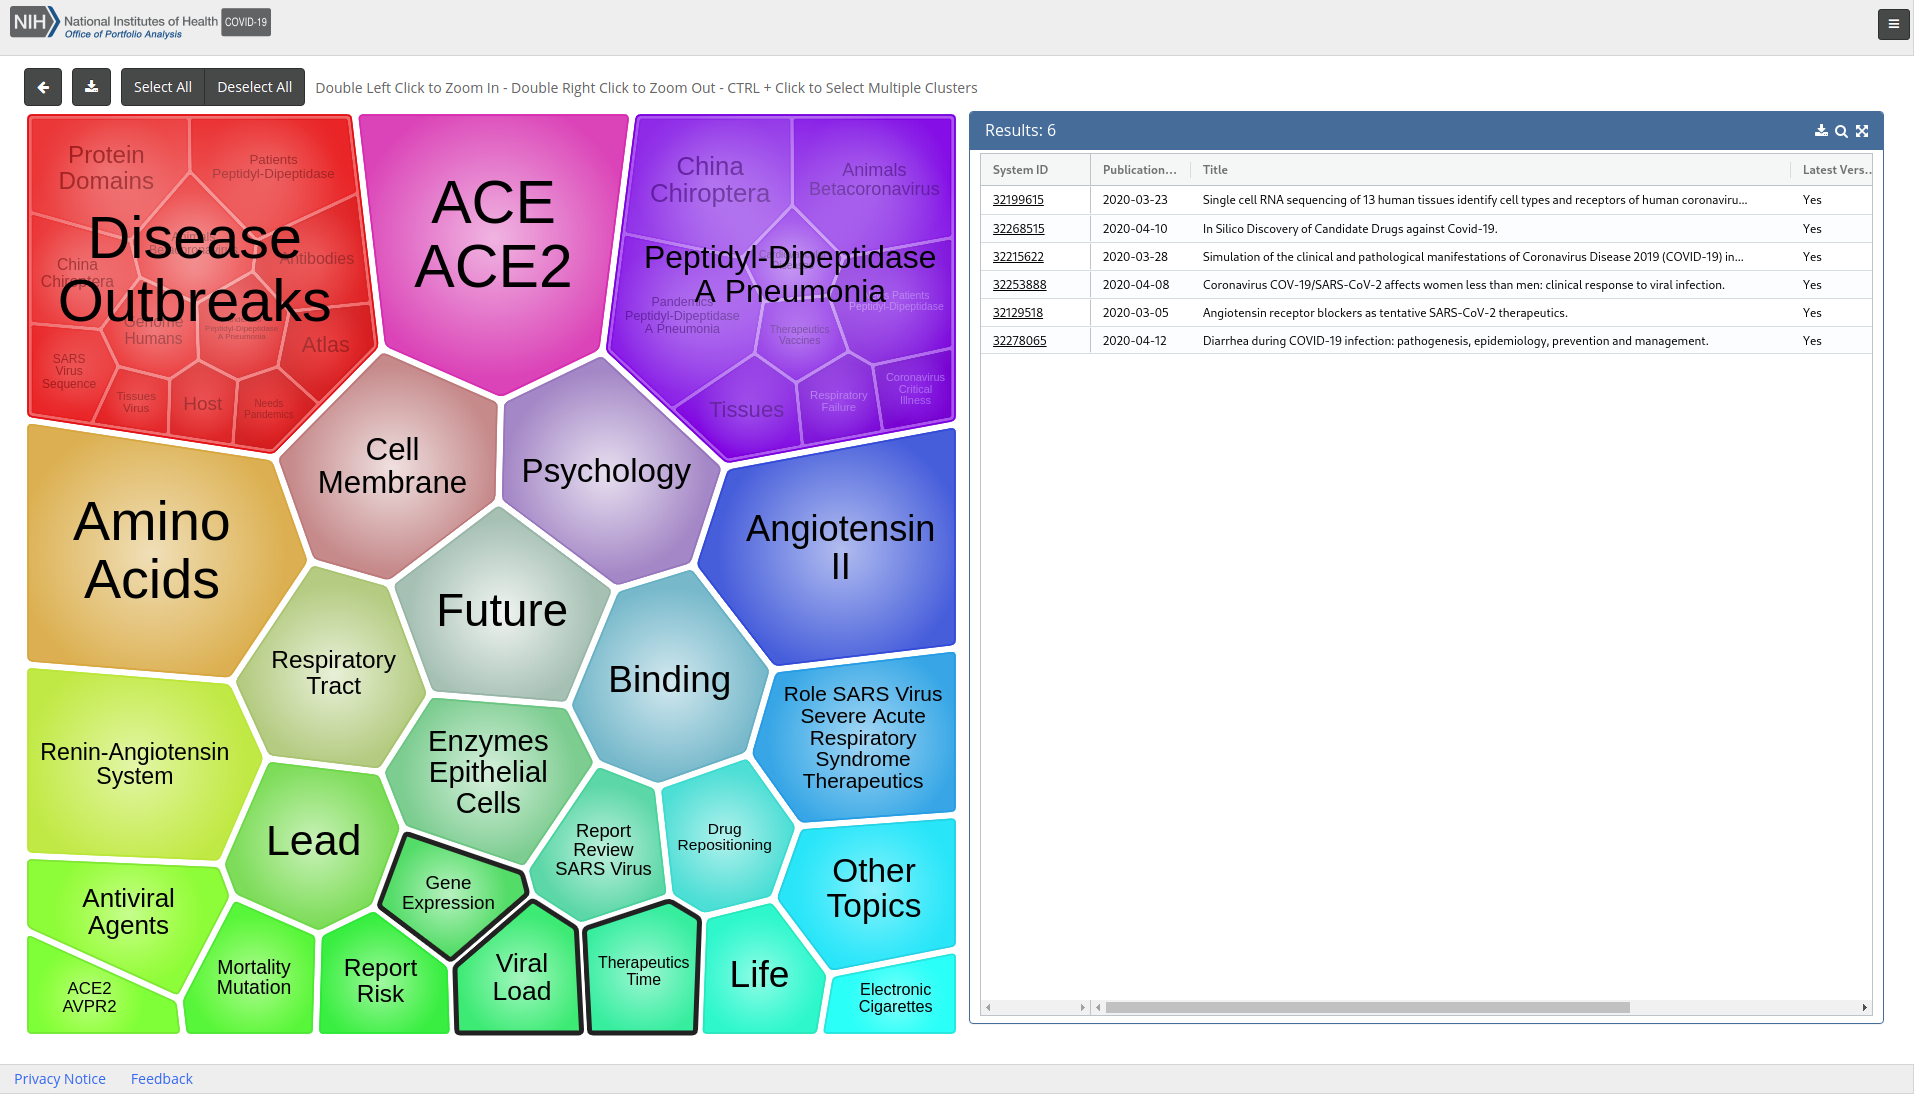
To select or deselect all clusters, or all cells within a zoomed in cluster, use the Select All and Deselect All buttons located over the visualization above the left-side panel.
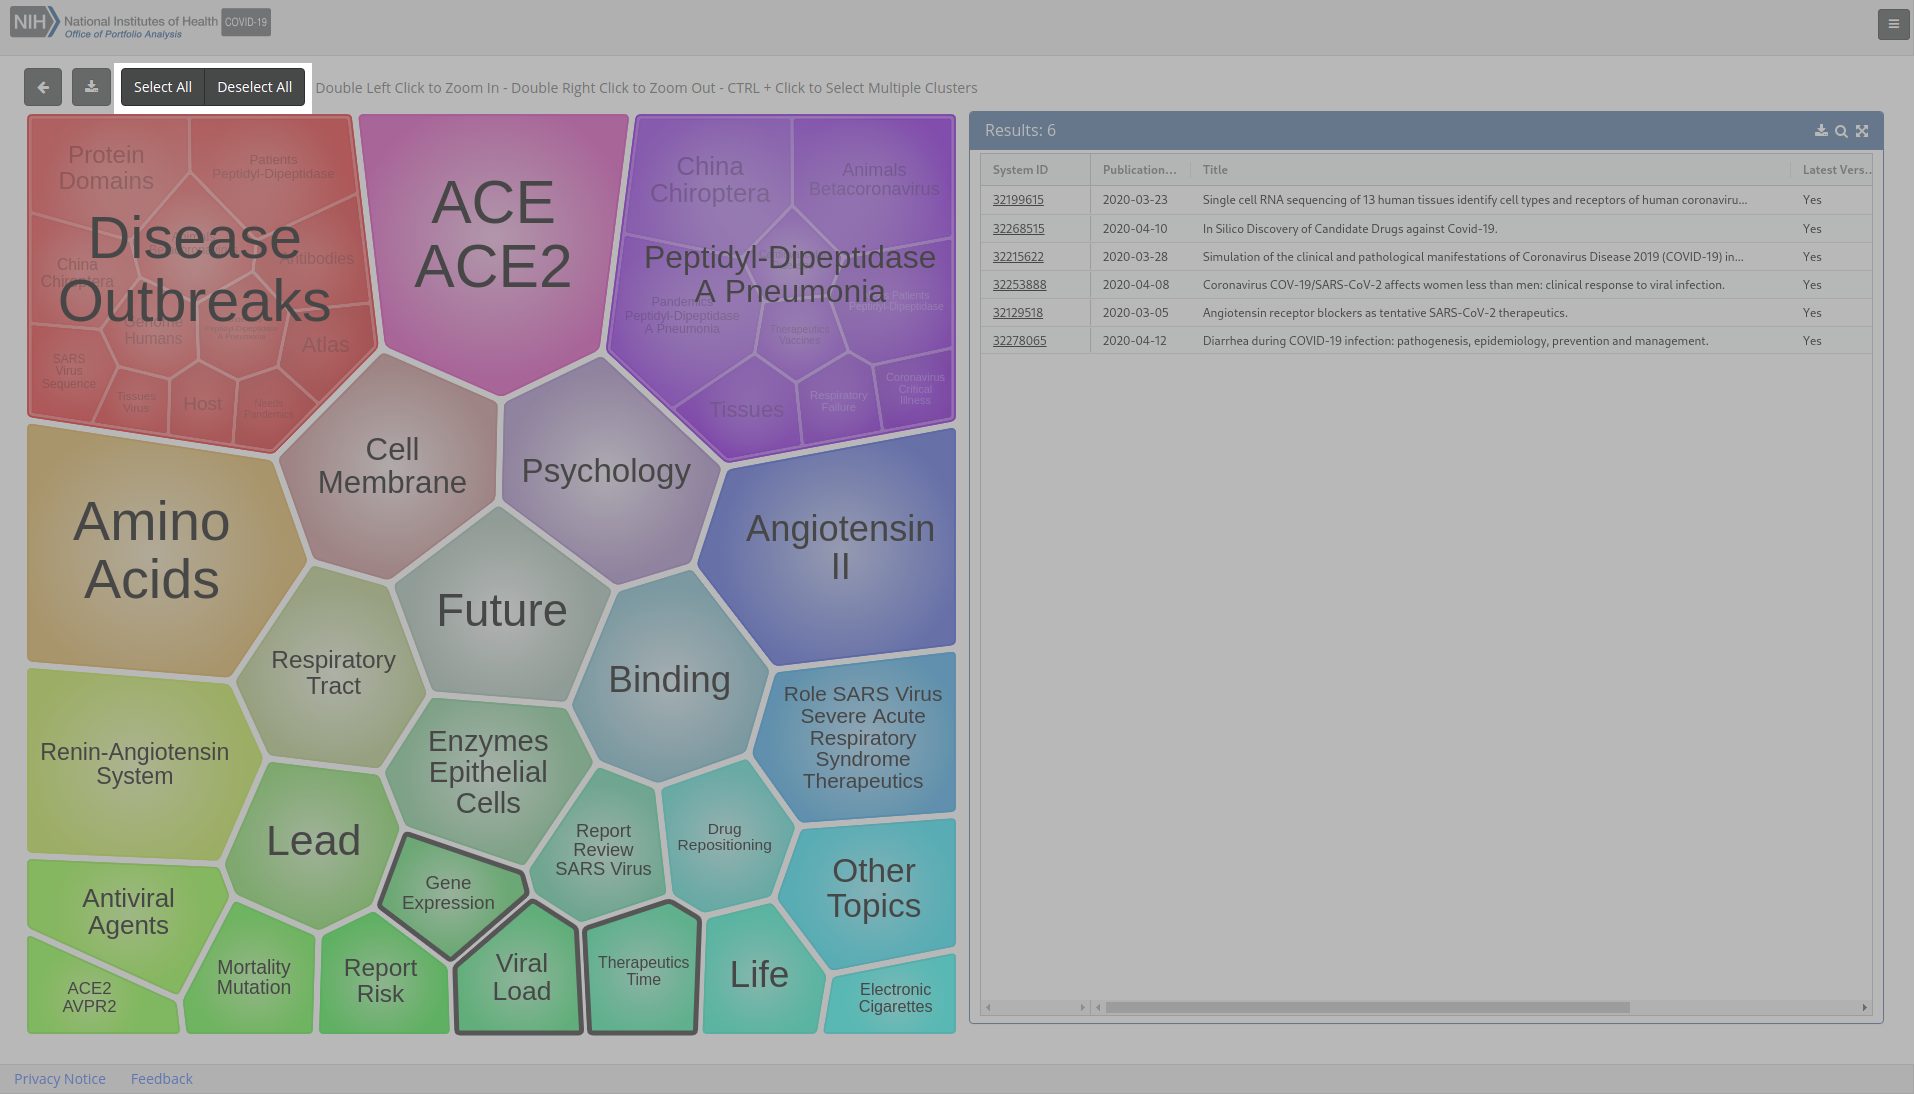
Table View
To view a record from the results table in the right side panel, click on the hyperlinked record ID in the far left column of the table.
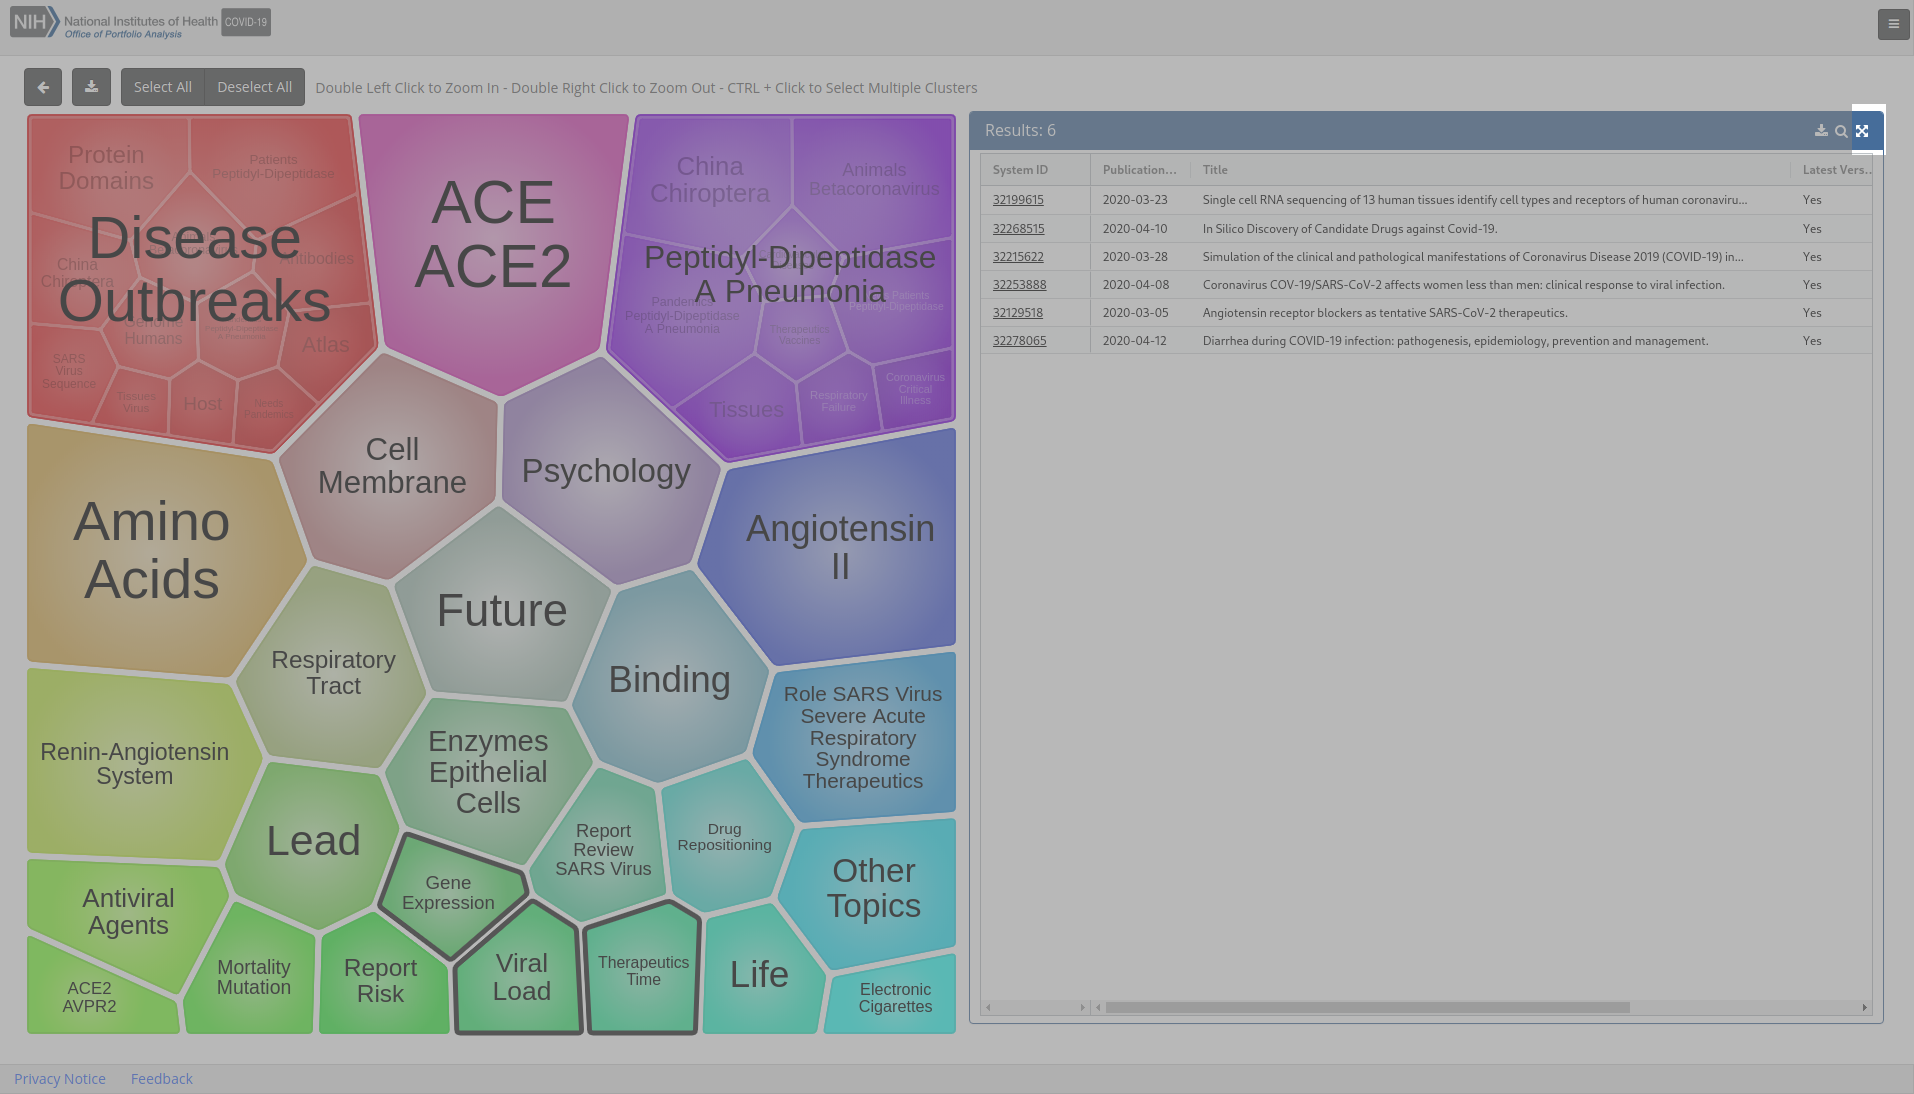
To expand the table and view more rows of records click the Maximize button in the top right corner of the table. To minimize and return to the normal table view, click the Minimize button in the top right corner of the table.
Searching Results from a cluster
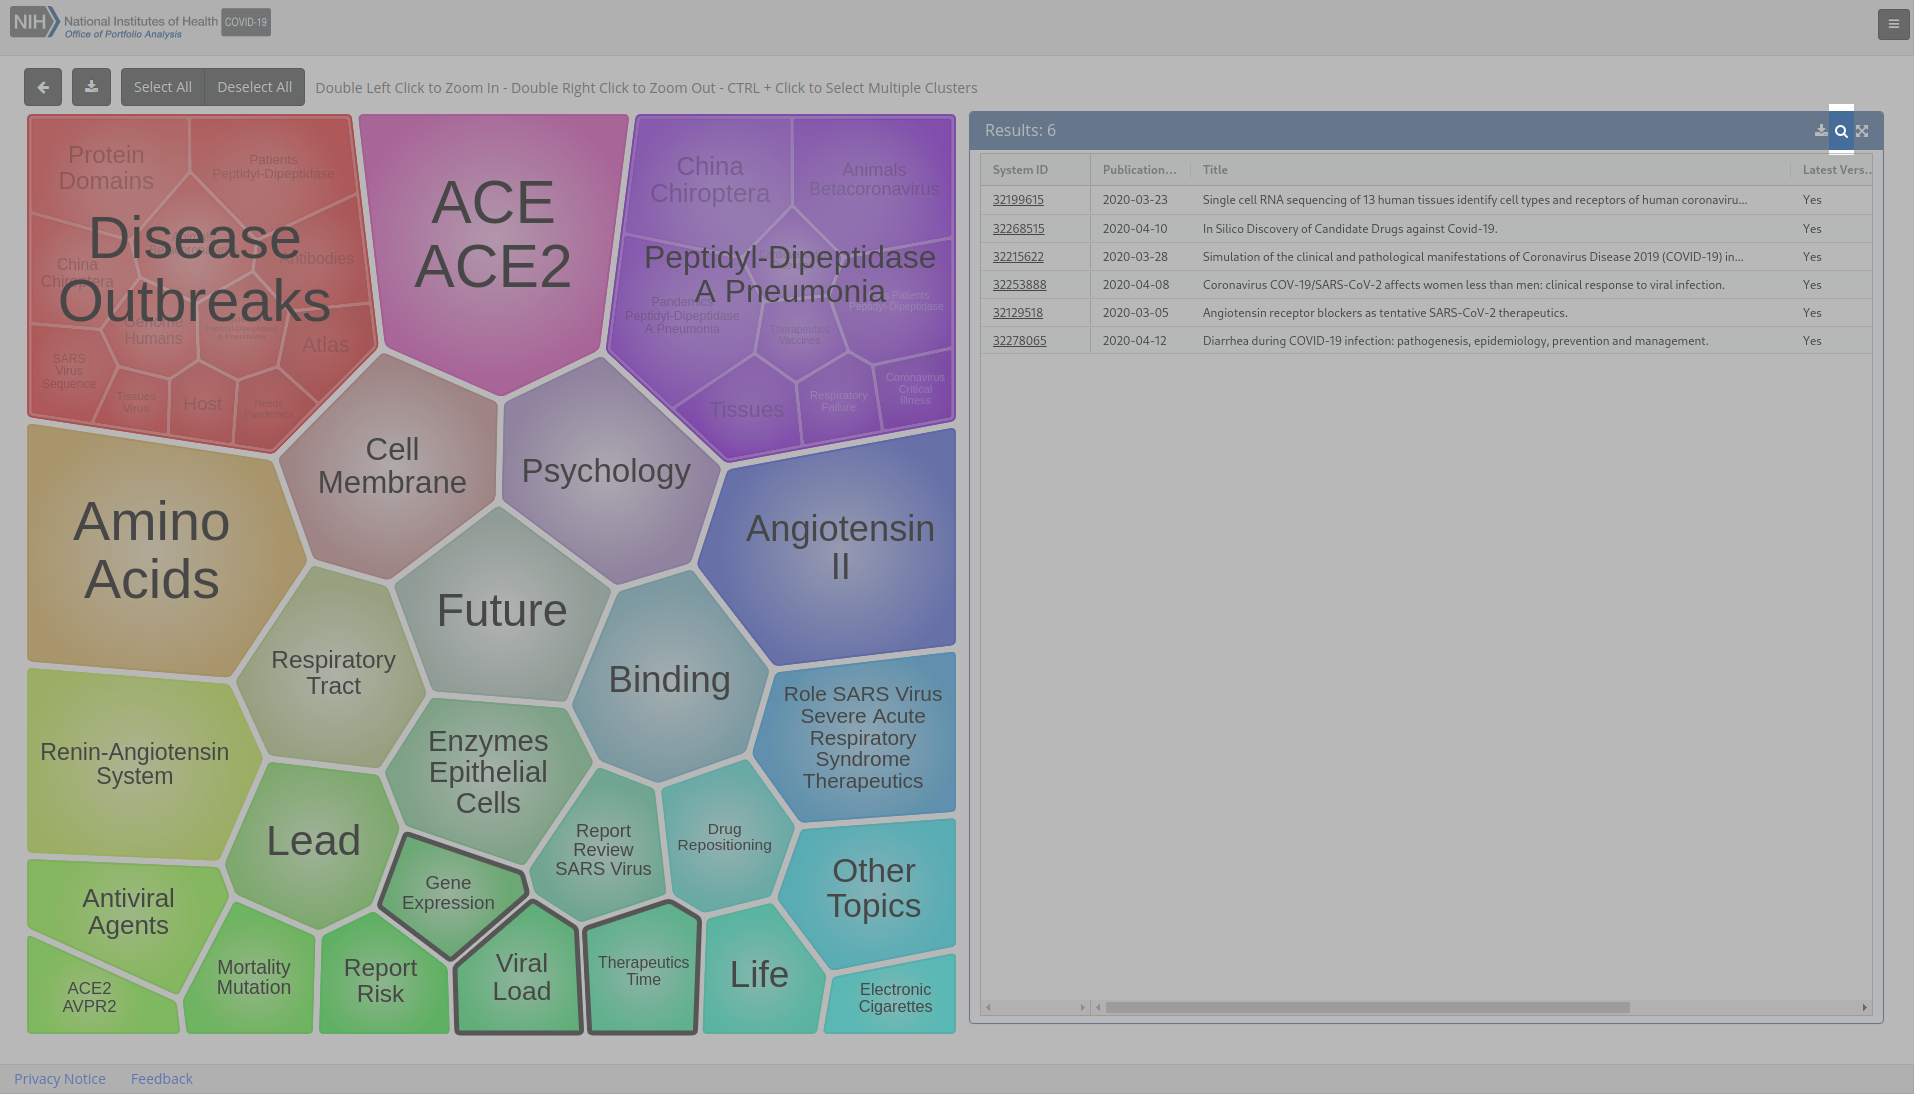
To search the records within the results table, click the Search button in the top right corner of the table and a search will be executed within the iSearch COVID-19 Portfolio application in a new browser tab or window.
Export Cluster Documents

To download the records in the results table, click the Export Cluster Documents button in the top right corner of the results table. A record can occur in multiple categories. In Export, records will show all of their categories, include the parent and child categories.
Download the Visualization
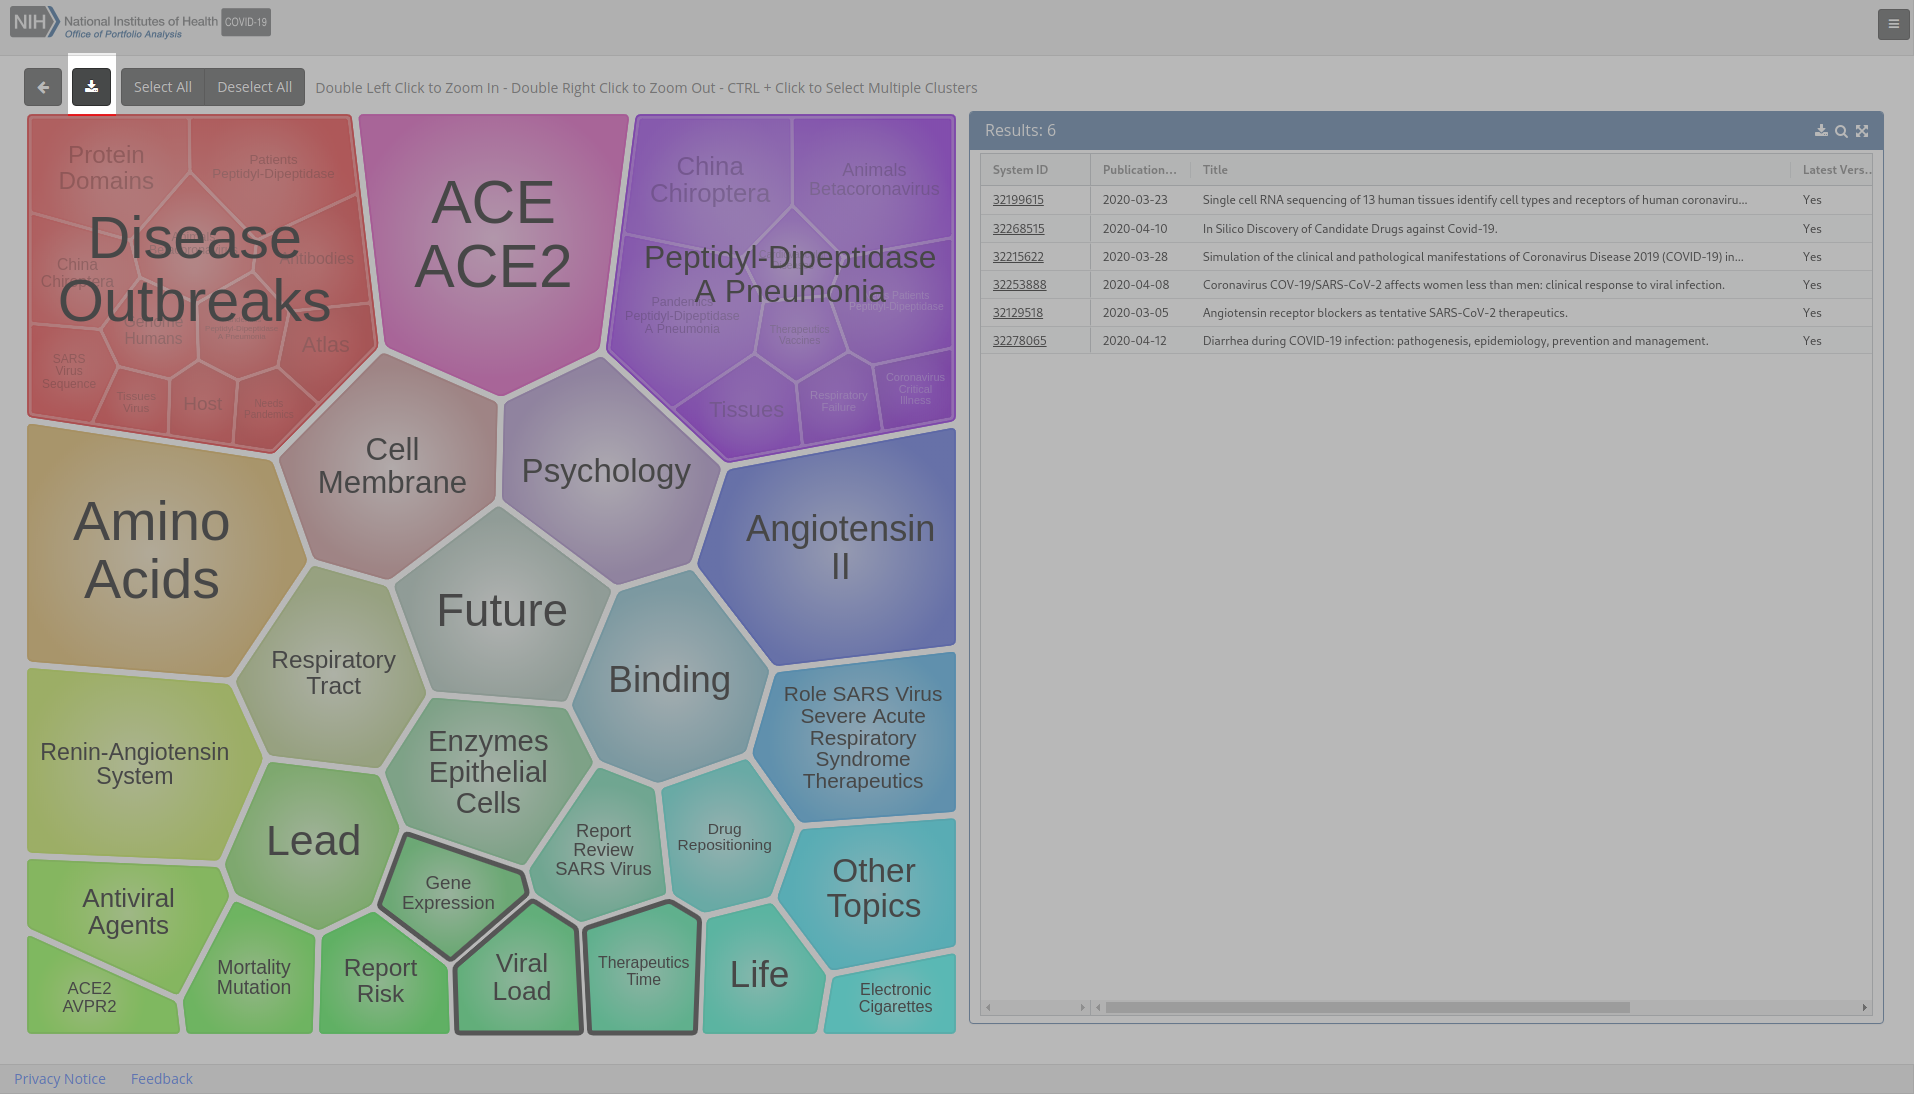
To download the visualization click the Download button, represented by a downward pointing arrow in the top left corner of the screen.
Return to Search
To exit visualize results and return to your search, click the Go Back button in the top left corner of the screen.